

2 A Short Tutorial
2.3 Using the debugger
A debugger tool is provided to help track down the cause of problems in your source code. This section introduces you to some of the ways in which it can be used.
- 1. Type the following definition into the listener:
(defun test ()
  (let ((total 0))
    (loop for i below 100 do
          (incf total i) when (= i 50) do
          (break "We've reached fifty"))))
- This function counts from 0 to 100, accumulating the total as it progresses, and forces entry into the debugger when the count has reached 50.
- 2. Next, call the function by typing
(test) into the listener.
- Initially, the command line debugger is entered. This is a debugger which can be used from within the listener itself. More details about the command line debugger can be found in the relevant documentation for the Lisp image that you are running.
- 3. To enter the debugger tool at this point, choose Debug > Debugger from the listener.
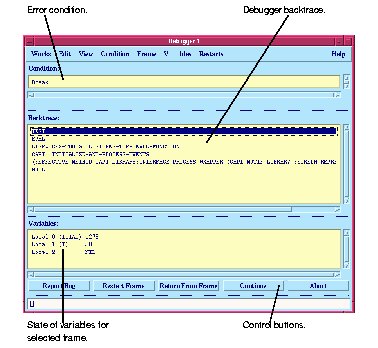
- The debugger tool appears, as shown in Figure 2.3.

Figure 2.3 Debugger tool
- The debugger tool gives a view of the backtrace (in the Backtrace area), showing the functions that were in the process of running, and their internal variables (including any arguments) at the point that the error occurred.
- 4. In the Backtrace area, click on
TEST if it is not already selected.
- This displays, in the Variables area, the values of the variables in the example. Notice that the value for
i is 50, as you would expect.
- There is a row of buttons at the bottom of the debugger which let you perform a number of different actions.
- 5. Click Continue to exit the debugger.
The debugger disappears from the screen, and the command line debugger in the listener is exited, leaving you at the Common Lisp prompt in the listener.
Common LispWorks User Guide, Liquid Common Lisp Version 5.0 - 18 OCT 1996 


Generated with Harlequin WebMaker


