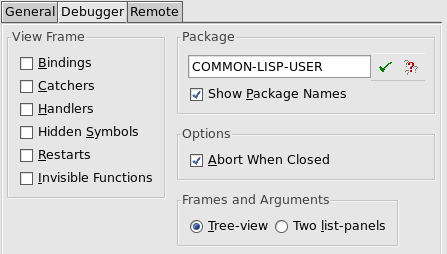


You can control the behavior and appearance of the debugger using the Preferences dialog.
To do this, raise the Preferences dialog by one of the methods described in 3.2 Setting preferences and select Debugger in the list on the left side of the dialog.
Debugger Preferences

By default, the call frame for each active function call in the backtrace is listed in the Backtrace area. There are a number of other types of call frame which are hidden by default. Display call frames of these types by selecting them in the View Frame panel of the debugger Preferences:
|
Lists the catch frames in the Backtrace list. | |
|
Lists the handler frames in the Backtrace list. | |
|
Lists any hidden symbols in the Backtrace list. | |
Note that all these commands can be toggled: choosing any command switches the display option on or off, depending on its current state. By default, all the options are off when the debugger is first invoked.
As with other tools, you can configure the way package names are displayed in the debugger tool in the Package box of the Debugger Preferences.
Check Show Package Names to turn the display of package names in the Backtrace and Variables lists on and off.
Specify a package name in the text box to change the process package of the debugger tool. You can use completion to reduce typing: click on  to which allows you to select from a list of all package names which begin with the partial input you have entered. See 3.14 Completion for detailed instructions.
By default, the current package is the same as the package from which the error was generated.
By default, when you close the Debugger window it attempts to abort, that is to call the abort restart.
Uncheck the Abort When Closed option only if you want to turn off this behavior.
To choose to view frames and variables in two lists rather than one tree, select the value Two list-panels in the Frames and Variables option.
The Remote tab is described in 29.4 Configuring Remote Debugging.
LispWorks IDE User Guide (Unix version) - 01 Dec 2021 19:37:07